4 Design Elements and Performance Indicators: An Analysis of Results
In the previous chapter, we explained how data for 216 accelerators and 4497 startups was obtained. The following analysis describes the collected data and puts it through statistical models to present the results for the tests of hypothesis.
4.1 Sample Analysis
4.1.1 Accelerators
Our sample contains 216 accelerators distributed by 23 countries in the European region (Figure 4.1). The two countries with the largest number of accelerators - the United Kingdom and Germany - account for over 50% of all analyzed programs, making them true hotspots for early- and seed-stage investments and interesting study objects for the purpose of this research (Table 4.1).
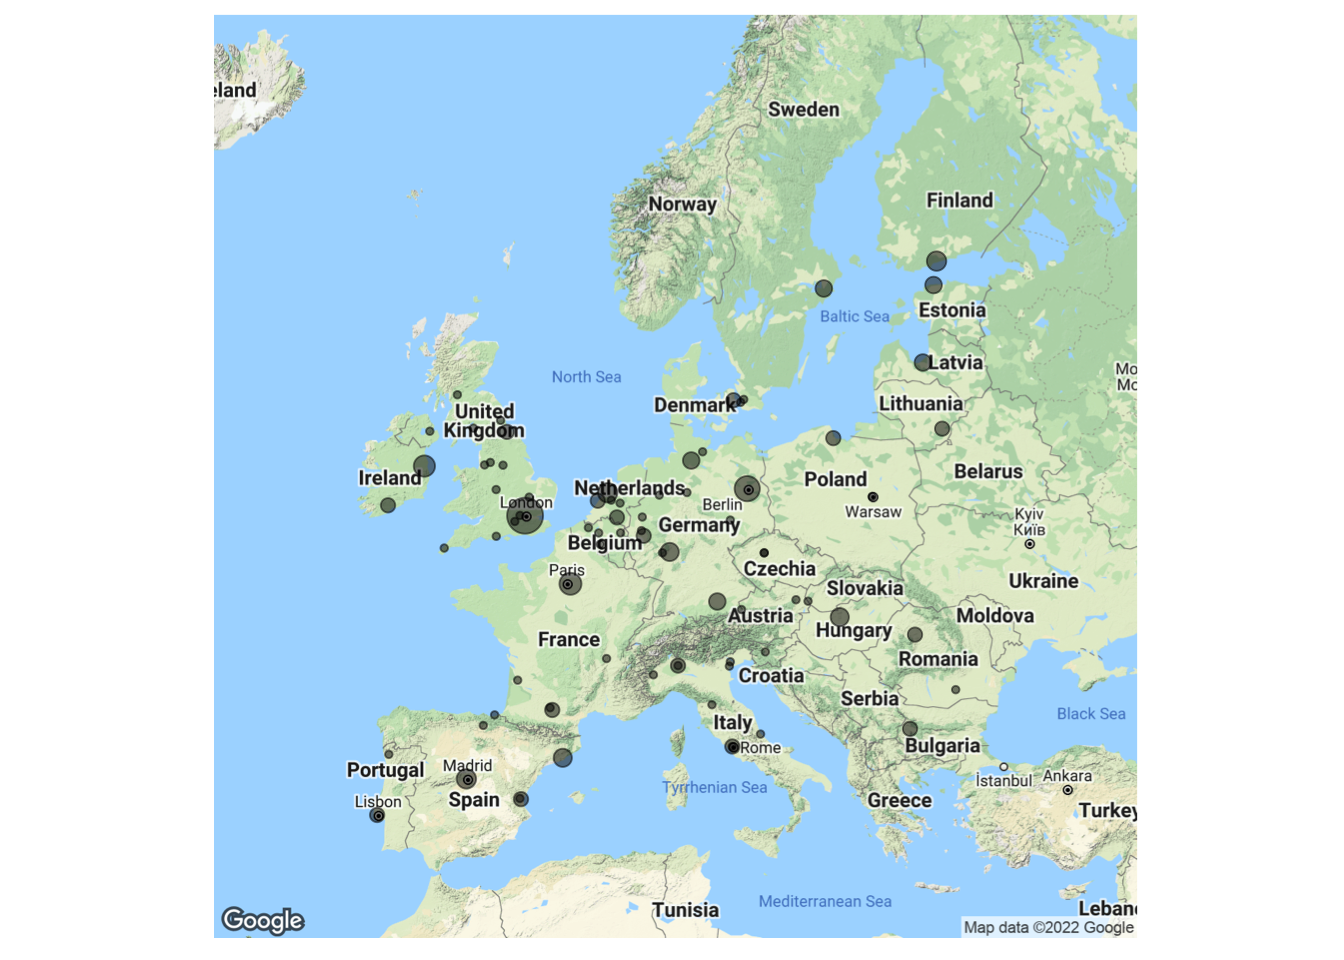
Figure 4.1: Accelerator Geographic Distribution.
| Countries | # |
|---|---|
| United Kingdom | 80 |
| Germany | 33 |
| Spain | 14 |
| France | 13 |
| The Netherlands | 12 |
| Italy | 11 |
| Ireland | 9 |
| Finland | 5 |
| Sweden | 5 |
| Hungary | 4 |
| Belgium | 3 |
| Estonia | 3 |
| Latvia | 3 |
| Poland | 3 |
| Portugal | 3 |
| Romania | 3 |
| Austria | 2 |
| Bulgaria | 2 |
| Czech Republic | 2 |
| Denmark | 2 |
| Lithuania | 2 |
| Slovakia (Slovak Republic) | 1 |
| Slovenia | 1 |
| Industry Cluster | Percentage |
|---|---|
| Financial Services | 23.102% |
| Lending and Investments | 11.334% |
| Professional Services | 8.731% |
| Information Technology | 5.098% |
| Software | 4.284% |
| Internet Services | 3.905% |
| Education | 3.037% |
| Science and Engineering | 2.820% |
| Data and Analytics | 2.440% |
| Health Care | 2.440% |
| Transportation | 2.278% |
| Community and Lifestyle | 2.115% |
| Media and Entertainment | 2.115% |
| Hardware | 1.952% |
| Commerce and Shopping | 1.518% |
| Sustainability | 1.464% |
| Real Estate | 1.356% |
| Artificial Intelligence | 1.193% |
| Energy | 1.193% |
| Sales and Marketing | 1.193% |
| Privacy and Security | 1.139% |
| Food and Beverage | 1.030% |
| Mobile | 1.030% |
| All Other Clusters | 13.232% |
| Statistic | N | Mean | St. Dev. | Min | Max |
| Cohort Size | 216 | 14.676 | 13.463 | 2 | 100 |
| Focused Cohort Composition | 216 | 0.546 | 0.499 | 0 | 1 |
| Program Duration (in number of weeks) | 216 | 19.412 | 15.127 | 0 | 144 |
| Funding Provided (in thousands of ) | 216 | 66.621 | 107.259 | 0 | 1,000 |
| Equity Taken | 216 | 5.032 | 5.389 | 0 | 25 |
| Provides External Mentors | 216 | 0.792 | 0.407 | 0 | 1 |
| Provides Formal Education | 216 | 0.250 | 0.434 | 0 | 1 |
| Provides Workspace | 216 | 0.769 | 0.423 | 0 | 1 |
| Graduation Event | 216 | 0.866 | 0.342 | 0 | 1 |
As for accelerator industry clustering, “Financial Services”, “Lending and Investments”, and “Professional Services” make up over 43% of the distribution. These categories represent the basic services offered by accelerators to their cohort of startups and were part of the definition of non-focused cohort compositions (which describes 54.6% of researched programs). The most relevant focused industry clusters include “Information Technology”, “Software” and “Internet Services” (over 13% of the distribution). During our research, we were able to confirm this statement: a large number of the studied programs engaged with tech startups regardless of their commitment to other specific industries.
Although the percentage of accelerators that include the “Education” industry cluster is relatively small (~3%), the percentage of those whose design choices include “Provides Formal Education” is much higher (25%). This disparity brings out the challenges of defining certain aspects of acceleration programs as previously stated and following Cohen and Hochberg (2014). Accelerators were found to have an average cohort size of 15 startups and a duration of 19 weeks (close to 5 months). The longest observed program ran for a full three years. Acceleration funding averaged $66621 with 5% equity in return for the provided services and mentorship. Most programs offered a workspace for startup teams and some form of external mentorship with their corporate, governmental, academic, or investor sponsors and stakeholders. 86.6% of accelerators chose to showcase the work of their cohort with a final graduation event, oftentimes referred to as demo day.
There are other components that make up the design of an accelerator program, considered in Tables 4.1 to 4.3: the backgrounds of founders and managing directors and the program’s sponsors. In Section 2.4.1 we made the case for the importance of these stakeholders especially in the strategy and entry criteria of the program.
| Statistic | N | Mean | St. Dev. | Min | Max |
| Prior Investor Exp. | 216 | 0.088 | 0.284 | 0 | 1 |
| Prior Entrepreneur Exp. | 216 | 0.528 | 0.500 | 0 | 1 |
| Prior Corporate Exp. | 216 | 0.444 | 0.498 | 0 | 1 |
| Prior Academic Exp. | 216 | 0.185 | 0.389 | 0 | 1 |
| Prior Investor Exp. | Prior Entrepreneur Exp. | Prior Corporate Exp. | Prior Academic Exp. | |
| Prior Investor Exp. | 1.000 | |||
| Prior Entrepreneur Exp. | 0.294* * * | 1.000 | ||
| Prior Corporate Exp. | 0.314* * * | 0.846* * * | 1.000 | |
| Prior Academic Exp. | 0.315* * * | 0.451* * * | 0.461* * * | 1.000 |
| Note: p<0.1; p<0.05; p<0.01 | ||||
Of all program founders and managing directors, 52.8% were found to have experience founding other companies or organizations whereas 44.4% had previously held a corporate job (Table 4.4). These two attributes describe a strong positive correlation with statistical significance - the strongest of the matrix -, leading us to believe that many founders first gained experience by working with other professionals and then went on to create their own companies. Data also reveals that 8.8% of founders and managing directors had experience as investors and 18.5% had prior academic experience.
Founders with prior experience as investors are the least likely to be closely related to academia while those with corporate experience are the most likely. Correlations between founder backgrounds are all positive and statistically significant (Table 4.5).
| Statistic | N | Mean | St. Dev. | Min | Max |
| Corporation Sponsor | 216 | 0.921 | 0.270 | 0 | 1 |
| Government Sponsor | 216 | 0.245 | 0.431 | 0 | 1 |
| Academia Sponsor | 216 | 0.194 | 0.397 | 0 | 1 |
| Investor Sponsor | 216 | 0.833 | 0.374 | 0 | 1 |
| Corporation Sponsor | Government Sponsor | Academia Sponsor | Investor Sponsor | |
| Corporation Sponsor | 1.000 | |||
| Government Sponsor | 0.127* | 1.000 | ||
| Academia Sponsor | 0.100 | 0.209* * * | 1.000 | |
| Investor Sponsor | 0.469* * * | 0.111 | 0.157* * | 1.000 |
| Note: p<0.1; p<0.05; p<0.01 | ||||
Apparent in the data (Table 4.6) is the proximity between acceleration programs and other corporations with 92.1% of these having close connections to a corporate sponsor. Data reveals that it is almost as important for accelerators to partner with investor sponsors: 83.3% of all programs included investors in their activities, be it throughout the program as mentors and advisors or as prospective backers present in the graduation events. Accelerators with corporate sponsors were shown to be correlated to those with investor sponsors as the data discloses a weak, positive correlation with statistical significance (Table 4.7).
A quarter (24.5%) of all accelerators were found to be linked to government institutions and 19.4% akin to an academic institution. The correlation coefficient between the latter is also weak but positive and statistically significant. Some associations were also found between government and corporation sponsors and between investor and academia sponsors but these are weaker and show less statistical significance.
4.1.2 Startups
Our sample of startups has 4497 complete observations with companies raising $3.4M on average. This value includes both the acceleration investments and any other rounds these firms may have been part of. Having access to the funding history of the analyzed startups, we were able to calculate the amount of raised capital in the year following the end of the acceleration program undergone by the company. 17.8% of all startups raised at least $500K in this period (Table 4.8).
| Statistic | N | Mean | St. Dev. | Min | Max |
| Received > 500K within 1 year | 4,497 | 0.178 | 0.382 | 0 | 1 |
| Total Raised (in millions of ) | 4,497 | 3.439 | 33.747 | 0.000 | 1,719.060 |
| Logged Total Raised | 4,497 | 8.785 | 6.322 | 0.000 | 21.265 |
| Max Valuation (in millions of ) | 504 | 63.451 | 487.088 | 0.015 | 9,000.503 |
| Logged Max Valuation | 504 | 14.838 | 1.760 | 9.616 | 22.921 |
| Exit of 1M or more | 4,497 | 0.007 | 0.083 | 0 | 1 |
The range of company valuations is extremely wide with the lowest valued at the $15K mark and the largest firm being valued at $9B. Only 0.7% of all analyzed firms had an exit of over $1M, considering both Initial Public Offerings (IPOs) and Acquisitions. For the final analysis, total raised and valuation values were logged as both are highly skewed and provide a more explanatory analysis when examined this way. In fact, according to Cohen et al. (2019), as per the literature, it is common to log these variables.
4.1.3 Typology
Through the trends disclosed by our initial data analysis, we intend to build upon Hausberg and Korreck (2020)’s research and typological groundwork that identifies several dimensions through which incubators can be classified: support strategy, business strategy, incubatee focus, institutional mission, sponsor/partner focus, and multi-dimensional. We propose a three-step classification process gathering information from the support strategy dimension - according to the model by Bruneel et al. (2012) -, the incubatee focus dimension - the model by Peters, Rice, and Sundararajan (2004) -, and the sponsor/partner focus dimension - merging all models analyzed by Hausberg and Korreck (2020).
Bruneel et al. (2012) put forward a generational classification model with three segments. The first generation incubator targeted provisioning of turnkey office space, the second added shared business support services and the third revealed the value of knowledge and people networks.
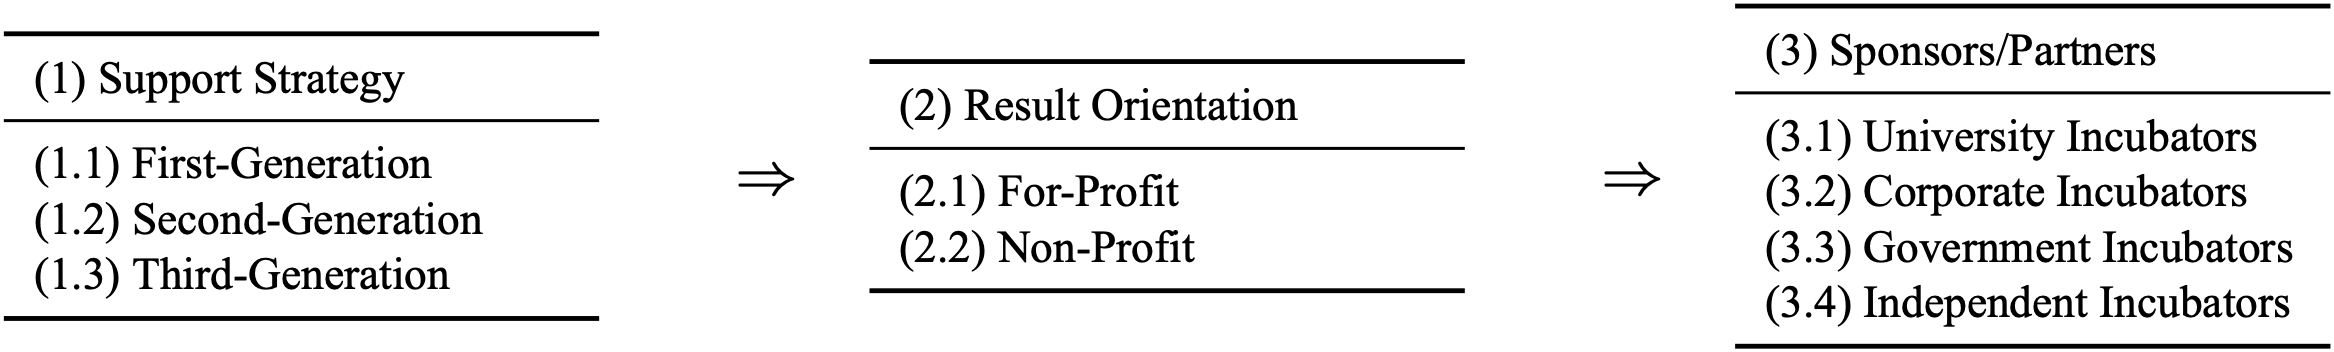
Figure 4.2: Incubator Typology Classification System.
Firstly, for the support strategy, this model is used to determine the concrete type of incubator:
(1.1) first-generation with a focus on real estate,
(1.2) second-generation with a focus on intangible assets,
and (1.3) third-generation with a focus on the network.
Secondly, applying Peters, Rice, and Sundararajan (2004) designation of:
(2.1) for-profit incubator,
And (2.2) non-profit, we achieve a classification accounting for the type of result coveted by the incubator.
In line with the classification by Peters, Rice, and Sundararajan (2004), the third model includes:
(3.1) university-based incubators as a broad indicator of the incubator’s funding and financial support mechanisms.
Having then identified the need for further classification as intrapreneurship efforts do not fit into any pre-established categories, a second typology of (3.2) corporate incubators is suggested following the literature. The reasoning for this approach lies in the studied differences between corporate and university-based incubators, which exist when comparing service provider, provided service type, and service receiver (Becker and Gassmann 2006).
Through further investigation and with the collected dataset at hand, another category is added to the third model: (3.3) government incubators, where the main sponsor and backer of the program is a public institution. This statement is supported by Grimaldi and Grandi (2005)’s model which proposes “regional public incubators” and Kuratko and LaFollette (1987) and Udell (1990) who suggest “publicly sponsored incubators”.
Even though it is not often in our dataset that incubators were found to be partner-less, many did not have one key institution or organization as a backer. Therefore, (3.4) independent accelerators are not edge cases and should be contemplated in this systemic approach. The complete system is described in Figure 4.2.
Although this model does not by itself configure a well- or ill-designed accelerator, it successfully depicts some of the trends surrounding the results described in this section. Expectedly, we consider all studied accelerators to match (1) support strategy (1.3) third-generation due to their provided mentorship and network: these two factors are part of the definition of accelerator and are the ones which more significantly distance them from their ancestor - the incubator. As for (2) results orientation and (3) sponsors/partners, results vary widely: all possible combinations were observed in the complete dataset. It is worth pointing out that (3.1) university incubators and (3.3) government incubators were found in fewer numbers (19.4% and 24.5%, respectively), against other sponsor types which were present in over 80% of our results.
| Dependent variable: | ||||
| Corporation Sponsor | Government Sponsor | Academia Sponsor | Investor Sponsor | |
| (1) | (2) | (3) | (4) | |
| Prior Investor Exp. | 0.173 (0.550) | -0.264 (0.384) | -0.610 (0.508) | -0.078 (0.404) |
| Prior Entrepreneur Exp. | -0.365 (0.441) | 0.064 (0.346) | -0.047 (0.361) | -0.067 (0.389) |
| Prior Corporate Exp. | 0.035 (0.444) | -0.132 (0.353) | -0.268 (0.374) | -0.131 (0.396) |
| Prior Academic Exp. | 0.769 (0.472) | -0.091 (0.286) | -0.030 (0.320) | 0.682** (0.347) |
| Constant | 1.486*** (0.189) | -0.629*** (0.133) | -0.690*** (0.135) | 0.967*** (0.148) |
| Observations | 216 | 216 | 216 | 216 |
| Log Likelihood | -57.520 | -119.674 | -103.519 | -95.169 |
| Note: | p<0.1; p<0.05; p<0.01 | |||
| This table utilizes probit regression to measure the association between accelerator founding sponsors and accelerator founding managing director backgrounds. | ||||
4.2 Statistical Analysis
To further understand the mechanisms behind the relationship of startup acceleration and the several design elements that make up these programs, further statistical analysis and tests were conducted, namely linear regression (for correlation matrices), multiple linear regression, and probit regression.
As previously theorized by Tripathi, Oivo, et al. (2019), accelerator performance can only be as good as the management and founders of the program. Third-generation incubators focus on networking and building their value proposition upon the connections made between the cohort and mentors. The relationship between founder backgrounds and accelerator sponsors is described in Table 4.9 where one interaction stands out from the rest: investor-sponsored accelerators are more likely to have founders with academic experience. This is the only statistically significant result with \(\beta\) = 0.682 and p-value < 0.05. The lack of significance for the other variables suggests that founder and managing director backgrounds do not play a large role in the type of sponsor attracted to and engaged with by the part of accelerators.
| Dependent variable: | ||||
| Prior Investor Exp. | Prior Entrepreneur Exp. | Prior Corporate Exp. | Prior Academic Exp. | |
| (1) | (2) | (3) | (4) | |
| Cohort Size | 0.024** (0.010) | 0.007 (0.008) | 0.005 (0.008) | 0.014* (0.008) |
| Focused Cohort Composition | 0.600** (0.296) | 0.443** (0.180) | 0.265 (0.181) | 0.502** (0.219) |
| Program Duration (in number of weeks) | -0.026 (0.016) | -0.009 (0.007) | -0.005 (0.007) | -0.009 (0.008) |
| Funding Provided (in thousands of ) | -0.00000 (0.00000) | -0.00000 (0.00000) | -0.00000 (0.00000) | -0.00000 (0.00000) |
| Equity Taken | 0.056** (0.027) | 0.045** (0.019) | 0.047** (0.018) | 0.031 (0.020) |
| Provides External Mentors | 0.134 (0.360) | 0.045 (0.224) | -0.074 (0.224) | -0.012 (0.261) |
| Provides Formal Education | -0.102 (0.338) | 0.138 (0.209) | 0.333 (0.209) | 0.402* (0.237) |
| Provides Workspace | 1.151** (0.530) | 0.327 (0.230) | 0.464** (0.236) | 0.195 (0.275) |
| Graduation Event | -0.826* (0.472) | -0.567* (0.293) | -0.496* (0.290) | -0.487 (0.321) |
| Constant | -2.308*** (0.690) | -0.126 (0.372) | -0.439 (0.369) | -1.247*** (0.421) |
| Observations | 216 | 216 | 216 | 216 |
| Log Likelihood | -55.093 | -140.269 | -139.963 | -96.234 |
| Note: | p<0.1; p<0.05; p<0.01 | |||
| This table utilizes multiple linear regression to measure the association between accelerator founding managing director backgrounds and accelerator program design choices. | ||||
A better way to illustrate the impact of management and sponsorship on accelerated startups is to measure the relationship between these stakeholders and the design elements of the programs (Table 4.10 and 4.11). Furthering this demonstration is possible by relating these structural components to accelerator company performance which, for this research, is done as part of the answer to Hypothesis #1 in Section 4.4.1.
Analysing Table 4.10, we observe that accelerators whose founders have prior investor experience tend to have a larger cohort size (\(\beta\) = 0.024, p-value < 0.05) with a focused composition (\(\beta\) = 0.6, p-value < 0.01) and provide a workspace for the teams (\(\beta\) = 1.151, p-value < 0.05). Since program graduation events are oftentimes showcase opportunities that bring together other entrepreneurs and investors to meet the participating startups, accelerator programs may disregard this opportunity in favour of the founder’s network of investors from previous ventures, thus revealing a lower probability of these accelerators hosting a demo day (\(\beta\) = -0.826, p-value < 0.1). In this scenario, the amount of equity taken also increases, as does in every model with founder and managing director backgrounds as the dependent variable (including those with an academic background but for which there is no statistical significance). Managers and founders with prior experience as entrepreneurs and with an academic background are also more likely to prefer focused cohorts (\(\beta\) = 0.443, p-value < 0.05; \(\beta\) = 0.502, p-value < 0.05, respectively). Leveraging their expertise on a specific industry vertical, professionals can support startup founders with specific knowledge and mentorship as well as connections to other companies and organizations.
Accelerators providing startups with physical workspace or a co-working office for the duration of the program are likely to have founders with corporate or investor experience. The proximity between managers and teams may be a contributing factor to the success of startups. Non-remote work environments are the norm for most individuals who have previously worked under the umbrella of a firm, therefore preferring this type of interaction (\(\beta\) = 0.464, p-value < 0.05) whereas founders with experience as entrepreneurs may consider remote work as a viable alternative. Accelerators founded by those with an academic background were found to have a higher likelihood of including a structured mentorship and education plan in their program (\(\beta\) = 0.402, p-value < 0.1). This relationship could be an indicator for the preference of professor-student interactions observed in academic environments.
| Dependent variable: | ||||
| Corporation Sponsor | Government Sponsor | Academia Sponsor | Investor Sponsor | |
| (1) | (2) | (3) | (4) | |
| Cohort Size | 0.003 (0.013) | 0.003 (0.008) | 0.003 (0.008) | -0.009 (0.009) |
| Focused Cohort Composition | -0.441 (0.297) | 0.249 (0.204) | 0.286 (0.206) | -0.461** (0.226) |
| Program Duration (in number of weeks) | -0.003 (0.011) | 0.027*** (0.008) | 0.001 (0.007) | 0.002 (0.008) |
| Funding Provided (in thousands of ) | 0.00000 (0.00000) | 0.00000 (0.00000) | 0.00000* (0.00000) | 0.00000 (0.00000) |
| Equity Taken | 0.003 (0.030) | -0.047** (0.021) | -0.032 (0.021) | -0.032 (0.023) |
| Provides External Mentors | 1.166*** (0.295) | 0.736** (0.293) | 0.141 (0.260) | 0.925*** (0.246) |
| Provides Formal Education | -0.482 (0.313) | -0.228 (0.252) | 0.128 (0.236) | -0.063 (0.257) |
| Provides Workspace | -0.289 (0.378) | 0.190 (0.263) | 0.053 (0.257) | 0.014 (0.273) |
| Graduation Event | -0.012 (0.435) | 0.061 (0.335) | -0.052 (0.323) | 0.013 (0.338) |
| Constant | 1.273** (0.536) | -2.024*** (0.504) | -1.213*** (0.415) | 0.676 (0.420) |
| Observations | 216 | 216 | 216 | 216 |
| Log Likelihood | -48.013 | -105.188 | -102.307 | -86.336 |
| Note: | p<0.1; p<0.05; p<0.01 | |||
| This table utilizes multiple linear regression to measure the association between accelerator founding sponsors and accelerator program design choices. | ||||
The linear model in Table 4.11 depicts the relationship between accelerator design elements and sponsors. Those sponsored by corporations, governments and investors look to be in favour of providing mentorship with external entities (individuals or organisations) (\(\beta\) = 1.166, p-value <0.001; \(\beta\) = 0.736, p-value < 0.05; \(\beta\) = 0.925, p-value < 0.01, respectively). Sponsorships often entail the participation of external stakeholders in the acceleration program timeline. This cooperation benefits all parties: accelerators provide a better and wider network of connections, increasing their value proposition; startups gain access to knowledge and experience; and the sponsoring entities foster innovation, intrapreneurship, research and development, and the opportunity to increase their portfolio with early-stage investments.
Opposite to the previous model, accelerators with a focused cohort have a higher likelihood of being involved with investor sponsors (\(\beta\) = -0.461, p-value < 0.05). No connection was found between the amount of funding provided and the type of sponsor chosen by accelerators, leading us to believe the two variables are not connected and do not influence one another in the context of this model.
| Statistic | Mean | St. Dev. | Min | Max |
| Investor Sponsor | 0.830 | 0.376 | 0 | 1 |
| Corporation Sponsor | 0.924 | 0.265 | 0 | 1 |
| Government Sponsor | 0.224 | 0.418 | 0 | 1 |
| Academia Sponsor | 0.182 | 0.386 | 0 | 1 |
| Prior Investor Exp. | 0.191 | 0.394 | 0 | 1 |
| Prior Entrepreneur Exp. | 0.824 | 0.381 | 0 | 1 |
| Prior Corporate Exp. | 0.752 | 0.433 | 0 | 1 |
| Prior Academic Exp. | 0.370 | 0.483 | 0 | 1 |
| Program Duration (in number of weeks) | 17.558 | 12.456 | 5 | 144 |
| Funding Provided (in thousands of ) | 74.962 | 90.648 | 0 | 1,000 |
| Equity Taken | 6.595 | 4.297 | 0 | 15 |
| Cohort Size | 13.470 | 10.660 | 3 | 100 |
| Focused Cohort Composition | 0.561 | 0.497 | 0 | 1 |
| Provides External Mentors | 0.724 | 0.448 | 0 | 1 |
| Provides Workspace | 0.873 | 0.334 | 0 | 1 |
| Provides Formal Education | 0.418 | 0.494 | 0 | 1 |
| Graduation Event | 0.867 | 0.340 | 0 | 1 |
| Statistic | Mean | St. Dev. | Min | Max |
| Investor Sponsor | 0.714 | 0.488 | 0 | 1 |
| Corporation Sponsor | 0.714 | 0.488 | 0 | 1 |
| Government Sponsor | 0.571 | 0.535 | 0 | 1 |
| Academia Sponsor | 0.000 | 0.000 | 0 | 0 |
| Prior Investor Exp. | 0.143 | 0.378 | 0 | 1 |
| Prior Entrepreneur Exp. | 0.571 | 0.535 | 0 | 1 |
| Prior Corporate Exp. | 0.571 | 0.535 | 0 | 1 |
| Prior Academic Exp. | 0.143 | 0.378 | 0 | 1 |
| Program Duration (in number of weeks) | 56.714 | 60.868 | 12 | 144 |
| Funding Provided (in thousands of ) | 47.857 | 70.229 | 0 | 150 |
| Equity Taken | 2.286 | 4.071 | 0 | 10 |
| Cohort Size | 41.000 | 41.437 | 5 | 100 |
| Focused Cohort Composition | 0.571 | 0.535 | 0 | 1 |
| Provides External Mentors | 1.000 | 0.000 | 1 | 1 |
| Provides Workspace | 0.857 | 0.378 | 0 | 1 |
| Provides Formal Education | 0.714 | 0.488 | 0 | 1 |
| Graduation Event | 1.000 | 0.000 | 1 | 1 |
| Ill-Designed Accelerator | Well-Designed Accelerator | |
|---|---|---|
| Investor Sponsor | 1 | 1 |
| Corporation Sponsor | 1 | 1 |
| Government Sponsor | 0 | 1 |
| Academia Sponsor | 0 | 0 |
| Prior Investor Exp. | 0 | 0 |
| Prior Entrepreneur Exp. | 1 | 1 |
| Prior Corporate Exp. | 1 | 1 |
| Prior Academic Exp. | 0 | 0 |
| Program Duration (in number of weeks) | 18 | 57 |
| Funding Provided (in thousands of $) | 75 | 48 |
| Equity Taken | 7 | 2 |
| Cohort Size | 13 | 41 |
| Focused Cohort Composition | 1 | 1 |
| Provides External Mentors | 1 | 1 |
| Provides Workspace | 1 | 1 |
| Provides Formal Education | 0 | 1 |
| Graduation Event | 1 | 1 |
4.3 Defining a Well-Designed Accelerator Program
Our dataset allows us to merge knowledge about accelerator program design and startup performance indicators. Filtering this information, we achieve the purpose of this chapter: to find trends regarding which accelerator design elements produce the best outcome for startups and therefore correspond to a well-designed accelerator.
To define an ill-designed accelerator program, we began by filtering the dataset for all startups that did not receive more than $500K in the year after their acceleration program and those that did not have an exit of $1M or more. We then filtered all accelerators whose startups did not achieve values over the mean of the study group for both total raised and max valuation. Calculating the mean for each variable of these startups’ accelerators, the outputs are revealed in Table 4.12. The inverse filter was applied to the dataset to find the startups better corresponding to the success parameters, with their accelerator’s design elements described in Table 4.13. Inspecting the outputs, the next step was to construct an ill- and well-designed accelerator (Table 4.14) which could be input in the model later described in the test of hypothesis for Hypothesis #1 in Section 4.4.1. Test results for this analysis are found in Hypothesis #2 in Section 4.4.2. It is relevant to state that, even though we are choosing to use the words “well” and “ill” to refer to an acceleration program’s design, we do so from the perspective of data.
4.4 Hypothesis Testing
We began this dissertation by asserting the end goal: to understand the impact of startup accelerator program design variables in a graduated startup’s chance of success in the European context. This chapter is dedicated to providing answers to our research questions - RQ1 and RQ2 - employing tests of hypothesis.
4.4.1 Hypothesis 1, H0: There Is No Significant Impact of an Accelerator’s Design Variables on the Performance Indicators of Its Accelerated Startups.
The first hypothesis aims to clarify the impact of each accelerator variable on the outcome of accelerated startups, in answering RQ1 “Do accelerator program design variables affect a graduated startup’s chance of success?”. To interpret these associations, multiple linear regression models were implemented: one for each indicator. These models have performance metrics as the dependent variable and an array of design elements as the independent variables (reported in Table 4.15). The formula goes as follows, where \(\beta_0\) is our constant, the intercept, \(\beta X_i\) i are the regression coefficients applied to a vector of design choices and \(\epsilon_i\) is the error term:
\[ Performance_i = \beta_0 + \beta X_i + \epsilon_i \]
| Dependent variable: | ||||
| Received > 500K within 1 year | Logged Total Raised | Logged Max Valuation | Exit of 1M or more | |
| (1) | (2) | (3) | (4) | |
| Investor Sponsor | 0.037* (0.020) | 2.083*** (0.323) | -0.030 (0.269) | -0.004 (0.004) |
| Corporation Sponsor | 0.063*** (0.019) | 0.306 (0.309) | 0.038 (0.295) | -0.008* (0.004) |
| Government Sponsor | 0.065*** (0.017) | 1.141*** (0.278) | -0.209 (0.229) | -0.001 (0.004) |
| Academia Sponsor | -0.048** (0.020) | -0.879*** (0.332) | -0.036 (0.276) | -0.0005 (0.004) |
| Prior Investor Exp. | 0.062*** (0.020) | 0.246 (0.321) | 0.108 (0.267) | 0.005 (0.004) |
| Prior Entrepreneur Exp. | -0.111*** (0.028) | -1.358*** (0.453) | -0.997** (0.398) | -0.007 (0.006) |
| Prior Corporate Exp. | 0.103*** (0.028) | 1.110** (0.457) | 1.022*** (0.389) | 0.005 (0.006) |
| Prior Academic Exp. | -0.009 (0.018) | -0.808*** (0.290) | -0.312 (0.221) | 0.002 (0.004) |
| Program Duration (in number of weeks) | -0.001** (0.0005) | 0.011 (0.008) | -0.005 (0.008) | 0.0001 (0.0001) |
| Funding Provided (in thousands of ) | -0.00000 (0.00000) | 0.00000 (0.00000) | 0.00000 (0.00000) | -0.000 (0.00000) |
| Equity Taken | 0.005*** (0.002) | 0.181*** (0.025) | -0.021 (0.023) | -0.001 (0.0003) |
| Cohort Size | 0.003*** (0.001) | 0.019* (0.010) | 0.036*** (0.010) | -0.00000 (0.0001) |
| Focused Cohort Composition | 0.002 (0.014) | 0.211 (0.228) | -0.341* (0.197) | -0.001 (0.003) |
| Provides External Mentors | -0.045*** (0.018) | -0.555* (0.287) | 0.136 (0.231) | 0.004 (0.004) |
| Provides Workspace | -0.063*** (0.022) | -0.263 (0.359) | -0.737** (0.292) | -0.002 (0.005) |
| Provides Formal Education | 0.011 (0.014) | 1.621*** (0.234) | -0.207 (0.205) | -0.003 (0.003) |
| Graduation Event | -0.166*** (0.028) | -1.873*** (0.455) | 1.091*** (0.365) | 0.006 (0.006) |
| Constant | 0.274*** (0.036) | 6.943*** (0.590) | 14.505*** (0.535) | 0.014* (0.008) |
| Regression P-value | 0 | 0 | 0 | 0.052 |
| Observations | 4,497 | 4,497 | 504 | 4,497 |
| R2 | 0.051 | 0.067 | 0.132 | 0.006 |
| Note: | p<0.1; p<0.05; p<0.01 | |||
| This table utilizes multiple linear regression to measure the association between accelerator company performance and accelerator program design choices. | ||||
The dependent variables “Received > $500K within 1 year” and “Exit of $1M or More” are binary, taking up the values 0 or 1, when true or false, respectively. “Total Raised” and “Max Valuation” variables were logged to account for skewness (as described in Section 4.1.2). Independent variables are either discrete (“Program Duration” in number of weeks, “Funding Provided” in amount, “Equity Taken” in percentage, and “Cohort Size” in number of startups) or binary (with values 0 or 1, false or true, respectively): “Investor Sponsor”, “Corporation Sponsor”, “Government Sponsor”, “Academia Sponsor”, “Prior Investor Exp.”, “Prior Entrepreneur Exp.”, “Prior Corporate Exp.”, “Prior Academic Exp.”, “Focused Cohort Composition”, “Provides External Mentors”, “Provides Workspace”, “Provides Formal Education”, and “Graduation Event”.
4.4.1.1 Received > $500K within 1 year
Multiple linear regressions were modelled for each dependent variable. In this case, we are trying to understand the impact of each startup design variable in their results the year following graduation from the acceleration program. Accelerators are meant to be a way to fast-track learning and market-fit for early-stage projects and companies and their completion is oftentimes signalled by a graduation event - a demo day. This event joins founders with other entrepreneurs and investors and is a great opportunity to start or continue work on the next rounds of investment.
Results for the regression with the “Received > $500K within 1 year” dependent variable (1) were shown to be significant, with a p-value < 0.01. We can therefore reject the null hypothesis and state that the design elements of accelerators have an impact on the probability of their cohort participants raising more than $500K in the year after completing the program. It is now important to identify the type of impact each element produces.
With the exception of Academia Sponsors (\(\beta\) = -0.048, p-value < 0.05), all other Sponsor types (Investor, Corporation, and Government) had a positive coefficient (\(\beta\) = 0.037, p-value < 0.1; \(\beta\) = 0.063; p-value < 0.01, \(\beta\) = 0.065, p-value < 0.01, respectively) meaning that, all other variables constant, a positive change in value for Sponsors will increase the chance of achieving the threshold of the indicator under analysis.
As for accelerator managing directors and founders, results vary. Those with an investment background have a small but positive impact (\(\beta\) = 0.062, p-value < 0.01) and so do those with corporate experience, with a slightly larger coefficient (\(\beta\) = 0.103, p-value < 0.01). Managers who had previously founded other ventures had a negative impact on this indicator (\(\beta\) = -0.111, p-value < 0.01). No statistically significant relationship was found when analyzing managers with an academic background.
The duration of the program revealed a small negative influence (\(\beta\) = -0.001, p-value < 0.05) on the performance indicator, whereas equity taken and cohort size had a limited but statistically significant positive impact (\(\beta\) = 0.005, p-value < 0.01, \(\beta\) = 0.003, p-value < 0.01, respectively). Focused cohort accelerators and those with a structured education plan had no statistically significant impact on immediate raised capital results though those providing external mentorship and a workspace influenced this parameter negatively (\(\beta\) = -0.045, p-value < 0.01, \(\beta\) = -0.063, p-value < 0.05, respectively). The design element with the greatest impact on this group was whether the accelerator provides a final graduation event: a negative coefficient (\(\beta\) = -0.166) with statistical significance which seems to contradict the idea that these showcasing opportunities are useful for startups trying to locate interested backers.
We have found that accelerators with investor, corporate, and government sponsors are more likely to cross the threshold of raising $500K in the year following their graduation from the program. The impact of managing directors and founders of this program isn’t felt as much but remains relevant in this context. Finally, in opposition to what was expected, the demo day was associated with a lower chance of raising large amounts of capital in the short-term.
4.4.1.2 Logged Total Raised
Another measure for startup success is the total amount of raised capital. Although this indicator lacks specific information on the quality of the company and its market fit, it gives us important details on the size of the market where this firm is inserted, how attractive it is to investors and, in turn, how the accelerator may have influenced these characteristics. In this section, we model a multiple linear regression with the accelerators design variables and a logged value of the total amount of capital raised by its cohort of startups.
The logged total raised dependent variable regression (2) is significant with a p-value < 0.01. We can also reject the null hypothesis for this model and assume there is an impact of certain accelerator design elements on the amount of total capital raised by startups through their lifespan.
The trend for sponsor impact in predicting total raised remains true when compared to the previously analyzed performance variable. Designing an accelerator with investor and government sponsors (\(\beta\) = 2.083, p-value < 0.01; \(\beta\) = 1.141, p-value < 0.01, respectively) appears to increase the chances of raising more capital. An academic sponsor presents a negative relationship to this same indicator (\(\beta\) = -0.879, p-value < 0.01).
The tendency to mimic the previous performance indicator progresses onto the background of accelerator founders and managers. Proven entrepreneurs and those with a background in academia lower the chance of startups raising a larger amount (\(\beta\) = -1.358, p-value < 0.01; \(\beta\) = -0.808, p-value < 0.01, respectively) while accelerators founded by individuals with corporate experience tend to see better results in this metric (\(\beta\) = 1.11, p-value < 0.05). Investment backgrounds show no statistical significance and so does the program duration variable. The amount of equity accelerators take and the educational plan of the accelerator also show a positive and significant impact (\(\beta\) = 0.181, p-value < 0.01; \(\beta\) = 1.621, p-value < 0.01, respectively). Cohort size is positive but less significant (\(\beta\) = 0.019, p-value < 0.1) and the composition of the cohort shows no significance. Finally, as with the previous performance metric, accelerators with a demo day perform worse when related to this indicator (\(\beta\) = -1.873, p-value < 0.01).
Our results indicate a positive relationship between startup performance and accelerators whose sponsors are from the investment industry and governmental organisations. We have also found that the impact of the managing directors of these programs is more impactful towards raising more investment should these have a background of working in the industry. Providing startups with a structured learning program also increased their chances of raising more capital but the idea that a final graduation event has a negative impact remains true.
4.4.1.3 Logged Max Valuation
Understanding the long-term impact of certain accelerator design variables on their graduated startups can be partly achieved by looking at the next two variables. In the case of max valuation, we modelled a multiple linear regression to explain which of these have more influence on the way markets and investors value the accelerated firms.
From the data collection process, information on company valuation proved to be the most difficult to find. For this reason, there is a discrepancy in the number of observations for model (3). Regardless, the logged max valuation regression outputs a p-value < 0.01, leading us to reject the null hypothesis and state that the structural elements of an acceleration program have a statistically significant impact on the valuation of analyzed startups.
All types of program sponsors prove to be statistically insignificant. Accelerator founder and managing directors with a background as entrepreneurs have a negative impact in predicting firm valuation (\(\beta\) = -0.997, p-value < 0.05) and those with corporate experience display a positive relationship in the same regard (\(\beta\) = 1.022, p-value < 0.01). Investor and academic backgrounds are not statistically significant when predicting this performance metric and neither are program duration, percentage of equity taken, external mentorship, and a formal education plan for startups. To strengthen the likelihood of a greater valuation, the number of startups in each cohort should be increased as (\(\beta\) = 0.036, p-value < 0.01), and the cohort composition focus should be set aside as it impacts this performance variable negatively, even if with reduced statistical significance (\(\beta\) = -0.341, p-value < 0.1). Providing a workspace for startups teams reduces total valuation (\(\beta\) = -0.737, p-value < 0.05) and a graduation event has the opposite effect (\(\beta\) = 1.091, p-value < 0.05).
Startup valuation was found not to be severely impacted by an accelerator’s design. The type of sponsors chosen to be part of the program showed no effect on the likelihood of a higher maximum valuation for companies. In terms of founders and managing directors, corporate experience was again put in the spotlight as a good predictor of performance. In the case of this long-term metric, the previous trend for a negative impact of graduation events was felt in the opposite direction: startups with higher valuations are more likely to have been part of acceleration programs providing a demo day.
4.4.1.4 Exit of $1M or More
The second measure for long-term startup performance concerns their exit value. This performance metric includes both IPOs and acquisitions and has been detailed by a multiple linear regression model. In this chapter, we aim to disclose the relationships occurring between the design elements of a startup accelerator and their startup’s probability of achieving an exit value of more than $1M.
The implemented regression for the binary dependent variable “Exit of $1M or More” (4) is the only one out of the group which provides reduced statistical significance with a p-value = 0.052 or p-value < 0.1. Singling out the fourth column of Table 4.15, we cannot reject the null hypothesis and thus conclude that the design variables of acceleration programs do not have an impact on the exit valuation of accelerated startups. However, it is important to point out some residual statistical significance present in the “Corporation Sponsor” variable which reflects negatively on the dependent variable (\(\beta\) = -0.008, p-value < 0.1). We also point out that most variables, even if not statistically significant, feature a negative value.
Our test results indicate that there is no proven relationship between an accelerator’s design variables and a startup’s long-term performance.
4.4.1.5 Hypothesis 1: Overview
A final consideration to be made on these regressions concerns the funding provided by accelerators, oftentimes in exchange for equity. As tested in Table 4.15, all \(\beta\)s near zero and there is no statistical significance when relating this design element to the startup performance indicators in review. Overall, three out of the four dependent variables showed statistical significance when modelled for multiple linear regressions and thus we are led to reject the null hypothesis that there is no significant impact of an accelerator’s design variables on the performance indicators of its accelerated startups. We conclude that accelerators can be designed in order to increase the chances of success for startups that go through their programs. We were also able to establish stronger relationships between short-term performance metrics than those associated with a startup’s long-term goals. This lack of correlation suggests one of two things: either the impact of acceleration is limited to the years directly after their graduation or there are other factors at play. Moving to the next test of hypothesis, we will further analyse these mechanisms.
4.4.2 Hypothesis 2, H0: Performance of Startups Graduating from Well-Designed Accelerators Is Not Greater than That of Startups Graduating from Ill-Designed Accelerators.
The second hypothesis to be tested delves deeper into the question of how and when, in the lifespan of a startup, the impact of participating in an acceleration program is felt. This test of hypothesis aims to answer RQ2 “Are there performance differences between startups who graduated from ill- and well-designed accelerator programs?”. We begin by detailing the perfect ill- and well-designed accelerators and then proceed to put one against the other, hoping to measure any differences in the performance of accelerated startups.
After filtering our dataset through the performance indicators, Tables 4.12 and 4.13 reflect the characteristics of an ill- and well-designed accelerator, summarised in Table 4.14. Inputting this data into each multiple linear regression model described in Hypothesis #1 in Section 4.4.1 (one per performance metric), we get fitted and confidence interval values. We proceeded to compute independent, two-sample T-Tests for all performance variables. These tests were designed to assess if the difference in means of metrics for ill- and well-designed accelerators is greater than 0, therefore indicating an increase in performance between startups graduating from well-designed accelerators. Tests conducted for each company performance variable point out different results.
| T-Test | Values |
| t | 2.916647 |
| df | 3.867084 |
| p-value | 0.02260685 |
| alternative hypothesis | true difference in means is greater than 0 |
| Note: Welch Two Sample t-test | |
| T-Test | Values |
| t | 5.620741 |
| df | 3.867084 |
| p-value | 0.002722757 |
| alternative hypothesis | true difference in means is greater than 0 |
| Note: Welch Two Sample t-test | |
| T-Test | Values |
| t | 1.114704 |
| df | 3.813443 |
| p-value | 0.1651271 |
| alternative hypothesis | true difference in means is greater than 0 |
| Note: Welch Two Sample t-test | |
| T-Test | Values |
| t | 0.5211857 |
| df | 3.867084 |
| p-value | 0.3153272 |
| alternative hypothesis | true difference in means is greater than 0 |
| Note: Welch Two Sample t-test | |
A well-designed accelerator, when compared to an ill-designed accelerator, demonstrated a significant increase in means for “Received > $500K within 1 year” with t = 2.917 and p-value < 0.05. The same test group indicated significantly larger amounts of “Total Raised” with t = 5.621 and p-value < 0.01. Regarding “Max Valuation”, no significant increase was found with t = 1.115 and p-value > 0.05. Lastly, well-designed accelerators were not found to have a higher chance of achieving an “Exit of $1M or More” with t = 0.521 and p-value > 0.05. Consequently, we can reject the null hypothesis for the “Received > $500K within 1 year” and “Total Raised” company performance variables but not for “Max Valuation” and “Exit of $1M or More” .
The choice to conduct tests in this manner, using only the predicted ill- and well-designed accelerators, instead of using the complete dataset of 216 accelerators resides in the filters chosen for their classification. For example, using a T-Test to compare well-designed acceleration programs whose startups “Received > $500K within 1 year” - or any other performance variable - against those ill-designed who did not would always indicate a positive significance difference.
4.4.2.1 Hypothesis 2: Overview
In short, we reject the null hypothesis that the performance of startups graduating from well-designed accelerators is not greater than that of startups graduating from ill-designed accelerators. Of the four tests, half revealed statistical significance, rejecting the null hypothesis. We hypothesise that the impact of acceleration is not limited to the years after the startups’ graduation. Accelerators who perfect the design of their programs have a longer-lasting, positive impact on their cohorts, even if restricted to the amount of raised capital as impact on valuation and exits is limited.